Grafana Dashboard
Pre-built Grafana dashboard for monitoring Cloudflare analytics collection
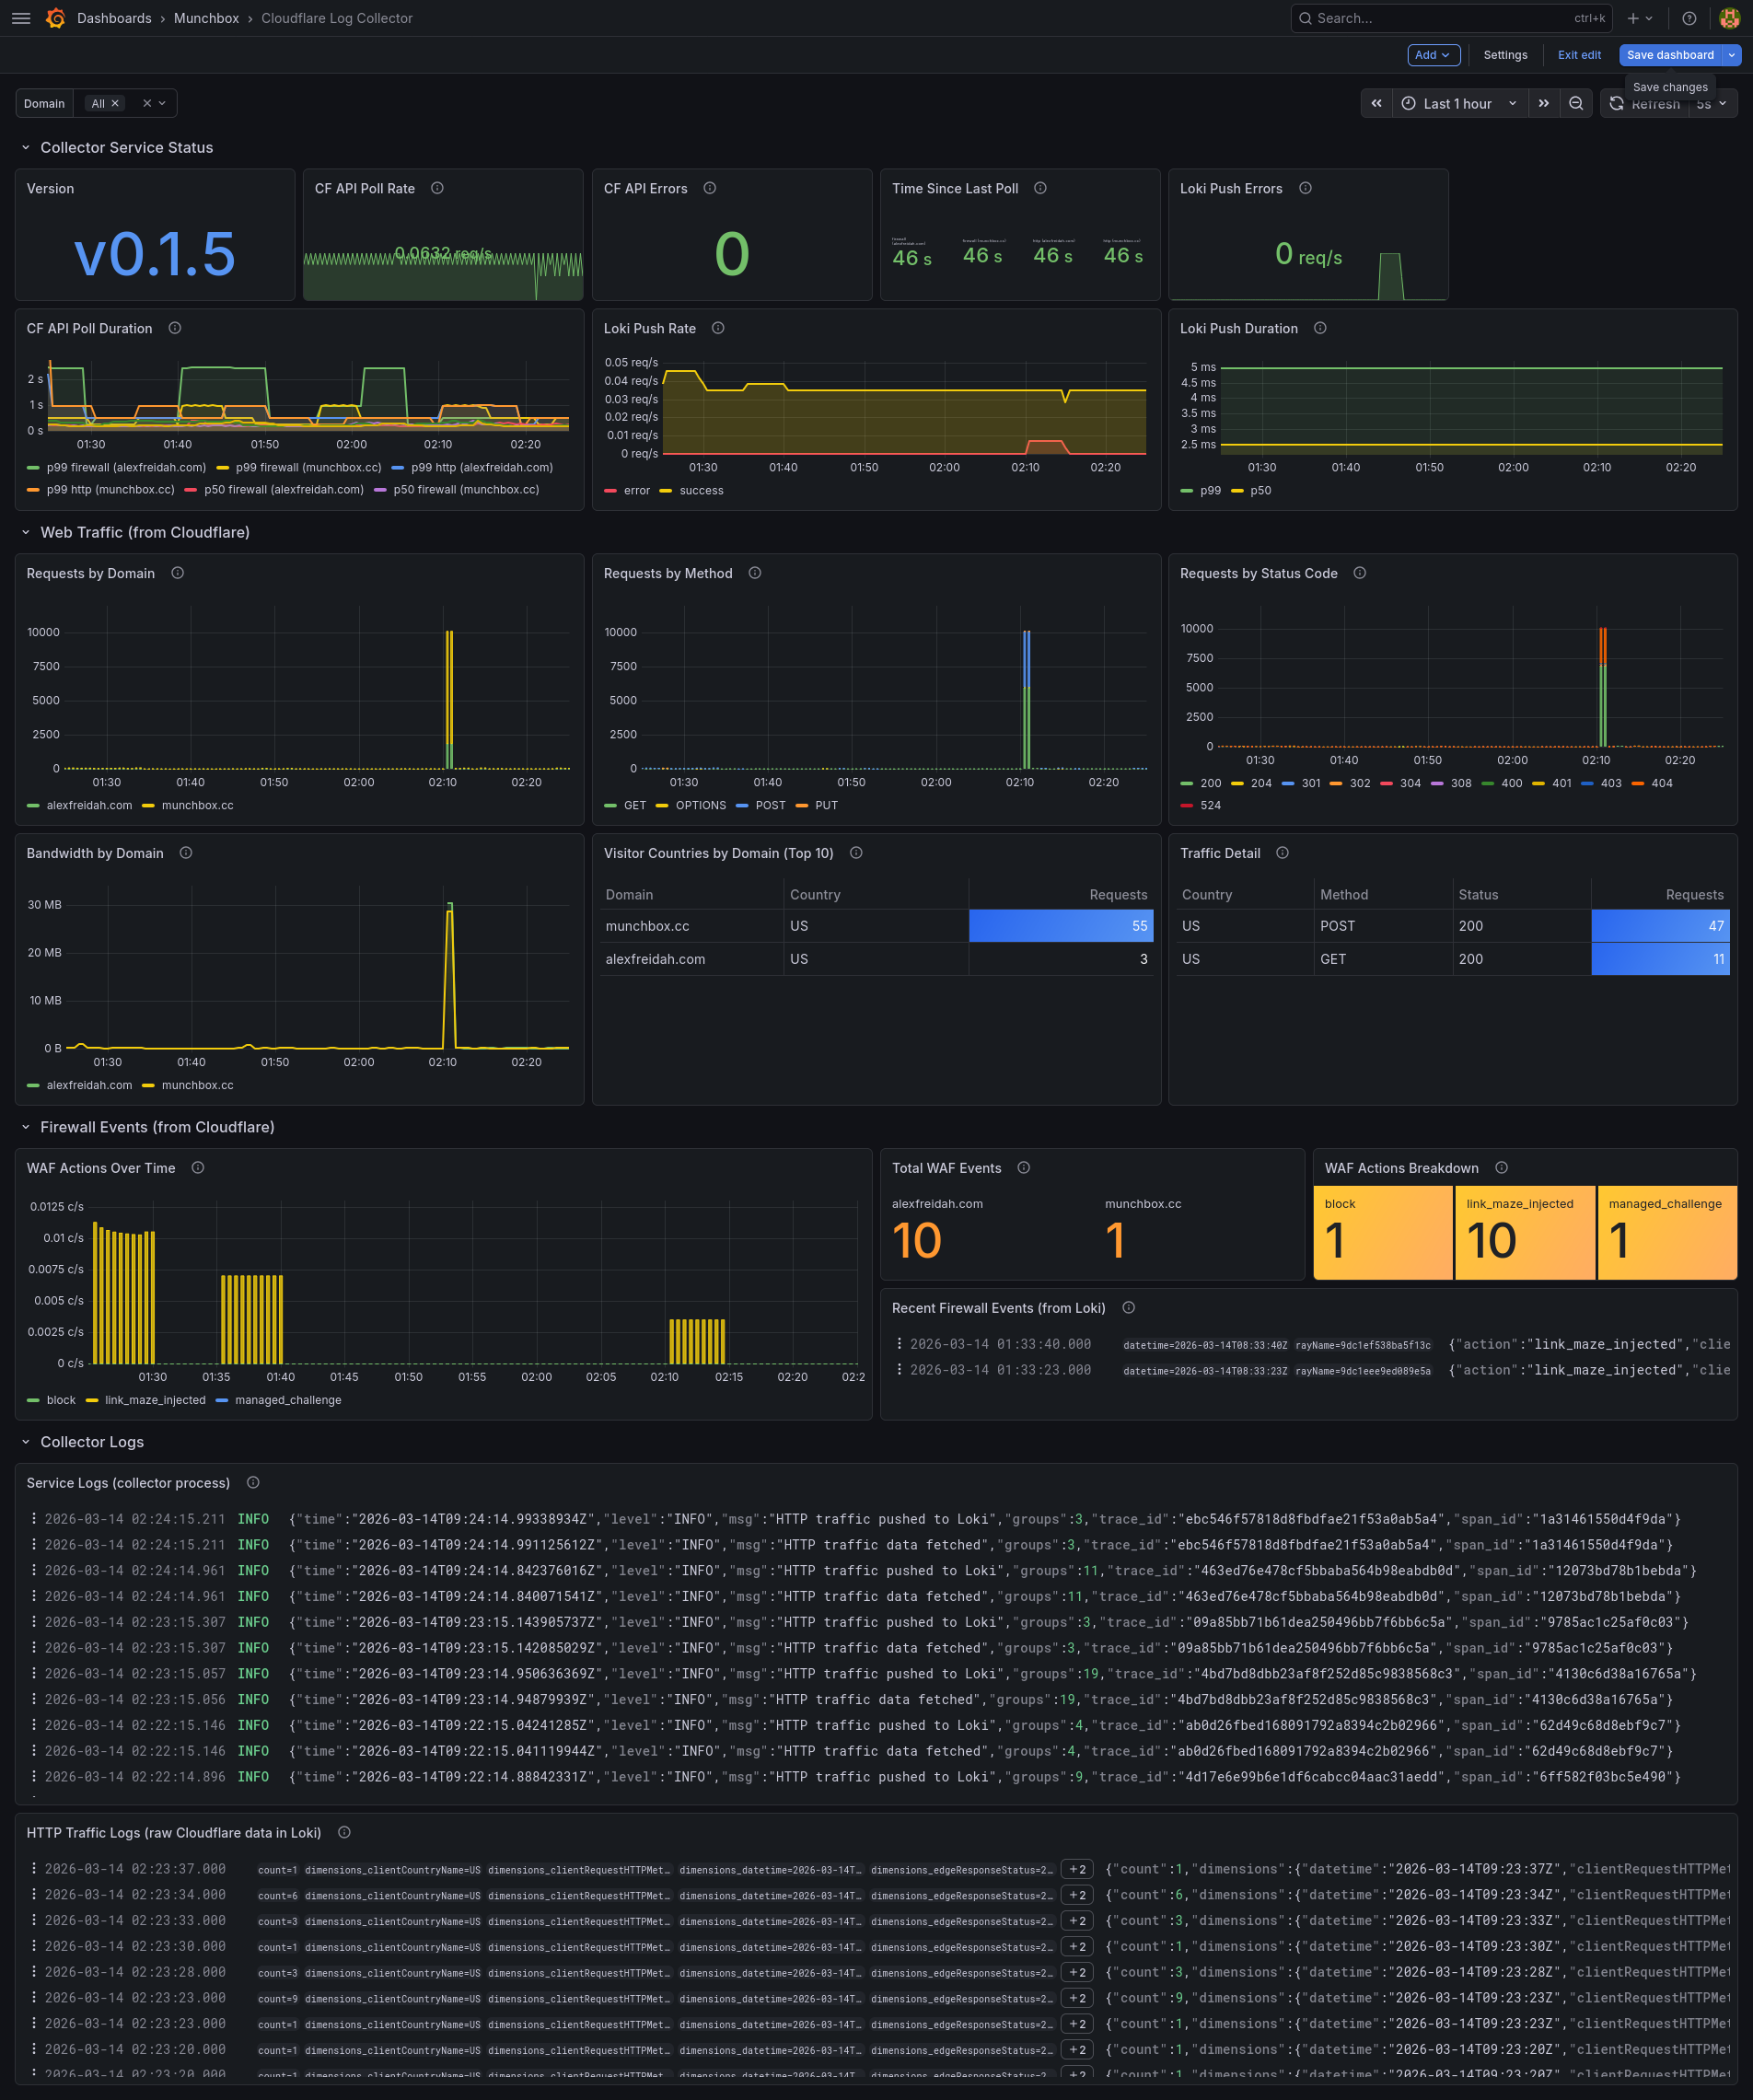
The dashboard tracks the full collection pipeline at a glance. Poll health panels show success/failure rates, latency histograms, and last-poll timestamps for each dataset and zone. Firewall events are broken down by action type (block, challenge, allow) with trending counters. HTTP traffic panels display request counts by method, status code, and country alongside edge response byte gauges. Loki push panels monitor push success rates and latency to catch delivery issues early. Build info and version metadata round out the overview.
Metrics
The dashboard visualizes the following Prometheus metrics exposed on the configured listen address (default :9101):
| Metric | Type | Labels | Description |
|---|---|---|---|
cflog_poll_total | counter | dataset, zone, status | Poll attempts by dataset, zone, and outcome |
cflog_poll_duration_seconds | histogram | dataset, zone | Poll latency |
cflog_last_poll_timestamp | gauge | dataset, zone | Unix timestamp of last successful poll |
cflog_firewall_events_total | counter | action, zone | Firewall events by action type |
cflog_http_requests | gauge | method, status, country, zone | HTTP request counts from last poll window |
cflog_http_bytes | gauge | type, zone | Edge response bytes from last poll window |
cflog_loki_push_total | counter | status | Loki push attempts by outcome |
cflog_loki_push_duration_seconds | histogram | Loki push latency | |
cflog_build_info | gauge | version, go_version | Build metadata |
Loki Streams
Two log streams are pushed to Loki and can be queried in Grafana:
| Stream | Labels | Content |
|---|---|---|
| Firewall events | {job="cloudflare", type="firewall", zone="..."} | One JSON log line per firewall event |
| HTTP traffic | {job="cloudflare", type="http_traffic", zone="..."} | One JSON log line per traffic group |